Google’s checkout form guidance ships an autofill token that does not exist
The string address-line-1 appears five times on web.dev, four of them inside an autocomplete attribute. Also the single-column study that excluded mobile, and why device conversion splits are partly artifact.

On this page
Google’s own guidance page for checkout forms ships an autofill token that does not exist.
On web.dev’s Payment and address form best practices, the string address-line-1 appears
five times, four of them inside an autocomplete attribute: autocomplete="address-line-1"
twice, plus autocomplete="shipping address-line-1" and autocomplete="billing address-line-1". The HTML Standard defines the token as address-line1, with no hyphen
before the digit, and contains zero occurrences of the hyphenated spelling. I checked both
pages by string search on 6 August 2026. The same web.dev code sample gets it right in one
attribute and wrong in the next: <input autocomplete="address-line-1" id="address-line1">.
An unrecognised token does not throw and does not warn in the console. It simply fails to match, leaving the field to the browser’s own field-name heuristics, which is where it would have been with no attribute at all. So a developer who copies the most-linked checkout forms page on the web gets worse mobile autofill than one who copies the specification, with no signal that anything happened. That matters more than any layout advice on the same page, because autofill is the only checkout change that removes the typing instead of rearranging it.
Why I was reading the specification
Because I stopped trusting my own reason for rebuilding a checkout.
Here is what I published at the time. These are my own unaudited figures from my own work, not anything a third party measured. 74% of my visitors were on mobile, and mobile customers were converting at roughly half the rate of desktop. Before buying more traffic I opened the store on my own phone and found a two-column form, shipping fields ahead of payment, and a coupon box sitting there inviting people to go hunting for a code. I made it single column, moved payment higher in the flow, and removed the coupon field on mobile. The edit took around 30 minutes. I ran the variant for a week and mobile completion improved from far behind desktop to almost matching it. The post is here.
The change was right. The reasoning that led to it was not, and the test that confirmed it cannot support the lesson I drew from it. Both of those are fixable, and fixing them is worth more than the result was.
The conversion gap was never evidence about the checkout
The gap on its own carries no information about my form. It is one ratio with no comparison group: nothing in it separates “my checkout is bad” from “a phone is a worse buying environment than a laptop”. I looked for a free primary source publishing a current device-split conversion benchmark and did not find one. The vendor benchmarks that get quoted for this sit behind lead capture forms, so I will not quote a figure I could not open. What justified the work was opening the checkout on a phone. The gap was the prompt. The walkthrough was the evidence. I had those two backwards.
The gap is worse than uninformative, though, because part of it is instrumentation.
Cross-device purchases debit mobile and credit desktop. GA4’s reporting identity falls back to device ID whenever User-ID is not collected, per Google’s own documentation. A shopper who browses on a phone and buys on a laptop adds a non-converting session to the mobile denominator and a converting session to the desktop numerator. Most small stores never set User-ID, so their device-split report is biased against mobile by construction.
Safari deletes the state that would let you recognise a returning visitor. WebKit announced that ITP “would cap the expiry of client-side cookies to seven days”, then extended the same rule to everything a script can write, “deleting all of a website’s script-writable storage after seven days of Safari use without user interaction on the site”. The affected list includes IndexedDB, LocalStorage, SessionStorage, media keys, and Service Worker registrations. Mobile traffic skews heavily to Safari. Returning iOS visitors are therefore re-counted as new sessions more often than returning desktop Chrome visitors, which inflates the mobile session denominator.
Both artifacts push the same way, and neither is visible in the report they corrupt.
How to detect this in your own system
Stop comparing sessions-to-orders by device. Compare checkout-start to order by device
instead. That ratio lives inside a single session on a single device, so cross-device
attribution cannot touch it and seven-day storage deletion cannot touch it. In GA4 terms it
is purchase over begin_checkout, segmented by device category.
Run both numbers side by side for a week before changing anything. If session conversion shows a wide device gap and checkout completion shows near parity, the problem is upstream of the checkout and redesigning the form will do nothing. If checkout completion is also far apart, you have a checkout problem and a metric clean enough to measure the fix with. Setting User-ID removes the first artifact for logged-in traffic. Nothing removes the second.
What the single-column evidence actually says
The canonical citation is Ben Labay’s study for CXL Institute, published 17 October 2016. CXL’s own copy now returns a 403, including to a request carrying a current Chrome user agent, so the readable original is on Speero. The instrument was CXL’s Trust Seal survey, not a checkout. Nobody bought anything. The outcome measure was form completion time, not completion rate and not revenue. The sample was 702 people fielded in early June 2016, n = 356 linear against n = 346 multi-column, and the single-column form was completed 15.4 seconds faster, significant at 95% on a two-sample t-test. And then the sentence almost nobody who cites the study reproduces: “We restricted the survey to desktop users.” The authors add their own caveat, that the results are “not directly transferable to all form types and situations”.
So the best-known quantitative evidence for single-column forms measured speed, on a survey, on desktop, ten years ago, and it is routinely quoted as proof that single column converts better, in checkouts, on mobile.
The change is still correct on mobile. It needs a mechanical argument rather than a borrowed statistic. On a 390 CSS-pixel viewport, two columns either shrink each control below a comfortable tap target or trigger pinch-zoom, and they break the vertical DOM order that the on-screen keyboard’s “Next” key walks. All three are confirmable in a device emulator in under a minute, which beats a decade-old desktop survey as a standard of proof.
The change that beats layout
If friction is the problem, the strongest available answer is fewer keystrokes, and the
specification is where that lives. The HTML Standard’s autofill token list is the actual API:
given-name, family-name, street-address, address-line1, address-line2,
address-level1, address-level2, postal-code, country, country-name, tel, email,
cc-name, cc-number, cc-exp, cc-csc, and the shipping and billing section prefixes
for forms that collect both addresses.
Three more from Google’s page, which are right even though its address token is not. Use
type="tel" for phone numbers and type="email" for email, so the phone renders the correct
keyboard. Never use type="number" for a card number: it “adds an up/down arrow to increment
numbers, which makes no sense for data such as telephone, payment card or account numbers”.
Use type="text" with inputmode="numeric" instead, in a single input rather than four split
boxes.
What the abandonment statistics actually say
Baymard’s cart abandonment figure is 70.22%, and Baymard states plainly what it is: “an average calculated based on 50 different studies”, spanning 2006 to 2025, ranging from 55.00% (Forrester 2010) to 84.27% (SaleCycle 2020), most recently fed by Uptain 2025 at 71.72%. It is a literature average of other people’s measurements across nineteen years, not a measurement of anything.
The reasons breakdown matters more here, and the circulating version is stale. On the live page, 42% of US online shoppers abandoned because “I was just browsing / not ready to buy”, and Baymard removes that segment before computing everything else. Of the remainder: 40% extra costs, 20% delivery too slow, 19% did not trust the site with card details, 18% forced account creation, and 17% “too long / complicated checkout process”. The 22% still quoted for checkout complexity was true of this same URL two years ago. The Internet Archive’s 1 June 2024 capture reads “22 % Too long / complicated checkout process” under a heading that says “2024 data”, and the 1 January 2022 capture reads 18% under “2021 data”. One URL, one question, three answers in four years: 18, then 22, now 17. The 26% that travels alongside it is not a checkout-complexity figure at all. It is the forced-account-creation row of that same 2024 table, “The site wanted me to create an account”, which the live page now gives as 18%. Cite 17%, name the date you read it, and say it is calculated after excluding four in ten respondents who were never going to buy. Baymard publishes no sample size or field date for that survey, so do not invent one.
Two more from the same publisher, and they disagree. The abandonment page, updated 22 September 2025, says the average US checkout displays 23.48 form elements by default, 14.88 counting only fields, against an ideal of 12 to 14 elements or 7 to 8 fields. Baymard’s blog post of 26 June 2024 says the 2024 average was 11.3 form fields, down from 11.8 in 2021 and 12.7 in 2019, against an ideal of 8. Different pages, different vintages, different definitions of what counts. Pick one, name it with its date, and do not average them. Baymard’s claim that better checkout UX is worth a 35% conversion increase comes from its own usability sessions and is sold as part of a paid product, so it is a vendor estimate.
The mobile speed number has degraded the same way. Milliseconds Make Millions, by Google, Deloitte Digital and Fifty-Five, reports an 8.4% conversion increase and a 9.2% average order value increase per 0.1s, from 37 brands, retail findings resting on 20.5m sessions. Its methodology section says “Approximately 4 weeks’ worth of hourly data was collected to reach statistical significance” and never says when those four weeks were. The document carries a “©2020 Deloitte Ireland LLP” line, so the data is at least six years old by now, but the window itself is undated and any date you see attached to this study is somebody’s inference. It is a logarithmic regression over an uncontrolled panel, and nobody’s site was made faster as an intervention. The appendix defines its own test: “In this context, statistically significant means a direct correlation was identified.” The same paragraph adds that where speed had “minimal or zero effect on funnel progression”, those observations “were not included in the report”. Its lead generation section records mobile conversion rates falling by almost 2% with faster speed, while the executive summary presents speed as uniformly positive. Faster sessions are also newer phones on better connections in richer postcodes, and the study cannot separate those.
What my test could and could not tell me
Fixing the duration at one week in advance was right for two reasons I would like to claim I planned. It covers a full weekly cycle, so day-of-week composition is balanced, and it is a fixed horizon rather than a stopping rule. Evan Miller’s demonstration is the one to keep in mind: running a significance test after every observation produces a 26.1% false positive rate against a nominal 5%, and his prescription is “Decide on a sample size in advance and wait until the experiment is over.”
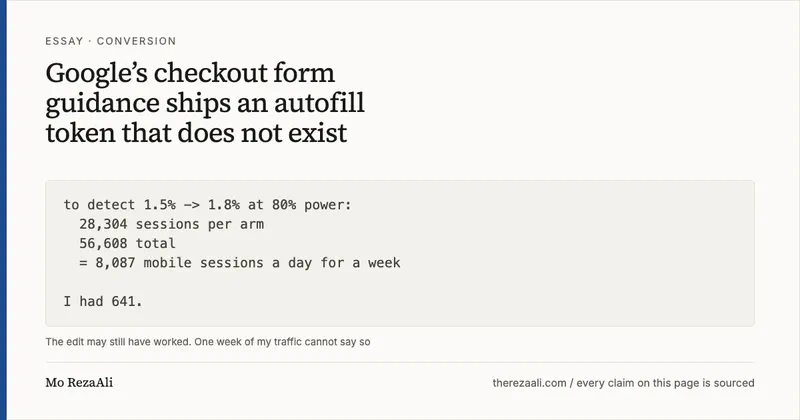
What I did not do was write down what “completion rate” was measured against. That omission decides whether the result means anything, because required sample size moves by two orders of magnitude depending on the denominator. Two-sided alpha of 0.05, power 0.80, standard two-proportion test. The base rates below are illustrative, not mine: I never published my own, and inventing them afterwards would be worse than admitting the gap.
Table: Sessions required per arm to detect a given effect at 80% power, by choice of denominator
| Metric and effect | n per arm | Total | Mobile traffic per day for 7 days |
|---|---|---|---|
| Session CVR 1.5% to 2.7% (+80% rel.) | 2,241 | 4,482 | 641 |
| Session CVR 1.5% to 1.8% (+20% rel.) | 28,304 | 56,608 | 8,087 |
| Session CVR 1.5% to 1.65% (+10% rel.) | 108,153 | 216,306 | 30,901 |
| Checkout completion 45% to 55% (+22% rel.) | 392 | 784 | 112 |
| Checkout completion 45% to 50% (+11% rel.) | 1,565 | 3,130 | 448 |
| Checkout completion 45% to 48% (+6.7% rel.) | 4,338 | 8,676 | 1,240 |
If completion rate meant checkout-starts to orders, a week at a few hundred mobile checkout starts a day is adequately powered and the finding stands. If it meant sessions to orders, a week of small-store traffic can only detect implausibly large effects, and a result at that volume is more likely noise than signal. I did not record which, so the honest statement is that the power of that test is unknown.
Two further limits, both structural. Three changes shipped as one variant, which is a valid test of “ship all three or none” and an invalid basis for the lesson “single column works”. And removing the coupon field was measured with a metric that cannot adjudicate it: taking the discount box away mechanically raises revenue per completed order, because fewer discounts get redeemed, while potentially suppressing orders from people holding a valid code. Completion rate reads both of those as success. Revenue per session tells them apart.
Designing so it cannot recur
- Instrument checkout-start to order by device permanently, and treat session-level device conversion as a directional signal at best.
- Write the denominator and the required sample size down before shipping the variant. If the required n exceeds what a week of traffic can deliver, do not run the test. Ship on mechanism and monitor.
- One change per variant, or state openly that you are testing a bundle and cannot attribute the result.
- Match the metric to the change. Layout goes to completion rate. Anything touching discounts goes to revenue per session.
- Copy autofill tokens from the WHATWG specification, not from articles about it, including this one. Check the list yourself.
- The strongest version of removing friction is removing the form, and it is an addition rather than a substitute. The Payment Request API hands the browser’s stored card and address to the site through a native sheet, so there is no layout to argue about. Read the banner at the top of MDN’s page for it before you plan around it: “Limited availability”, and “This feature is not Baseline because it does not work in some of the most widely-used browsers”. It also requires a secure context. So it is a progressive enhancement over a correctly tokenised form, and the form is still what a share of your mobile traffic will actually see. Building the sheet and skipping the tokens leaves the fallback path worse than where you started.
And know your platform before quoting anyone’s timings, including mine. On Shopify, “Checkout UI extensions for the information, shipping, and payment steps are available only to stores on a Shopify Plus plan”, so a 30-minute checkout edit is not a number that transfers. The platform sets the floor for the rest, too. HTTP Archive’s 2025 crawl puts Shopify origins at 76% passing Core Web Vitals in both the desktop and mobile tables, against WooCommerce at 33% and 35%. Before blaming your traffic, find out which of those you are standing on.
What holds up
The lesson in my original post survives with one repair. Sometimes the ads are not the problem and the funnel is. But the funnel claim needs a metric the browser and the analytics tool have not already corrupted, and the device-split conversion rate that made me suspicious in the first place does not qualify.
The limitation I wrote then still stands and I would not soften it. A cleaner checkout does not fix a weak offer. If people do not want the product, reducing friction only helps them leave faster. That work paid because demand already existed and the form was in the way.
What I have now that I did not have during those 30 minutes: a device metric that measures behaviour rather than storage policy, a denominator written down before the test rather than after it, one variable per variant, revenue per session for anything that touches a discount, and a form specification instead of a form opinion. The result I reported is the least useful thing I got out of that week.
Sources
Every source below was opened and checked on the date shown. Links open in this tab.
- I Was Paying For Clicks That My Checkout Was Killing Mo RezaAli on X x.com Accessed 6 August 2026
- Payment and address form best practices web.dev, Google web.dev Accessed 6 August 2026
- HTML Standard, 4.10.18.7 Autofill WHATWG html.spec.whatwg.org Accessed 6 August 2026
- Form Field Usability: Should You Use Single or Multi-Column Forms? [Original Research] Speero speero.com Accessed 6 August 2026
- 50 Cart Abandonment Rate Statistics 2026 Baymard Institute baymard.com Accessed 6 August 2026
- 49 Cart Abandonment Rate Statistics 2024 (archived capture, 1 June 2024) Baymard Institute via Internet Archive web.archive.org Accessed 6 August 2026
- 46 Cart Abandonment Rate Statistics (archived capture, 1 January 2022) Baymard Institute via Internet Archive web.archive.org Accessed 6 August 2026
- Checkout Optimization: Minimize Form Fields Baymard Institute baymard.com Accessed 6 August 2026
- E-Commerce Cart & Checkout Usability Research Baymard Institute baymard.com Accessed 6 August 2026
- Milliseconds Make Millions Think with Google, Deloitte Digital and Fifty-Five www.thinkwithgoogle.com Accessed 6 August 2026
- Full Third-Party Cookie Blocking and More WebKit webkit.org Accessed 6 August 2026
- Reporting identity Google Analytics Help support.google.com Accessed 6 August 2026
- How Not To Run An A/B Test Evan Miller www.evanmiller.org Accessed 6 August 2026
- Ecommerce, The 2025 Web Almanac HTTP Archive almanac.httparchive.org Accessed 6 August 2026
- Payment Request API MDN Web Docs developer.mozilla.org Accessed 6 August 2026
- Checkout UI extensions Shopify.dev shopify.dev Accessed 6 August 2026